Predicting Energy Usage
Inspiration
While paying my utility bills, I noticed fluctuations in my monthly costs. This led me to explore whether I could forecast these changes and develop a budgeting tool to estimate expenses and provide a monthly budget.
Process
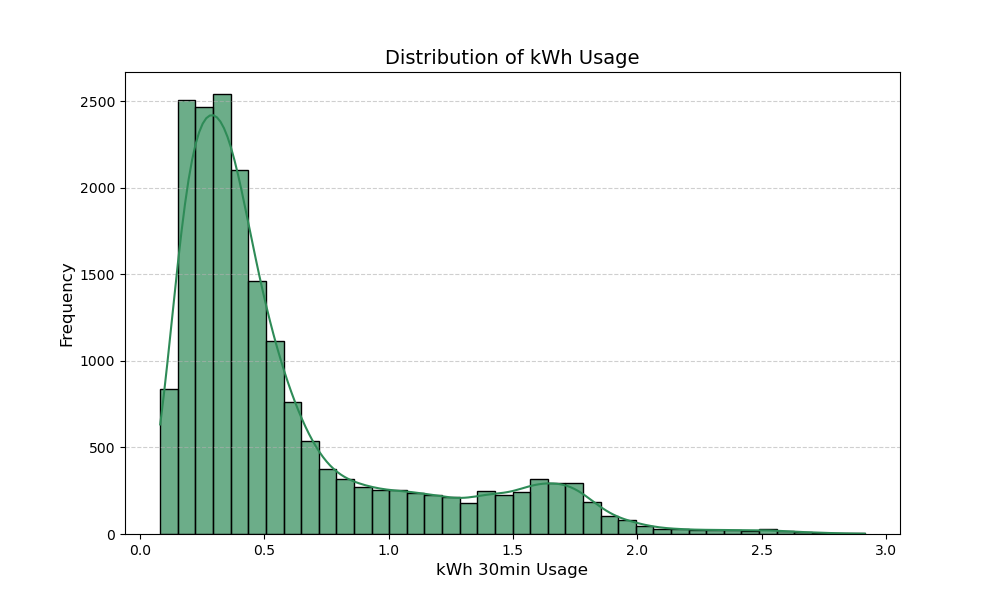
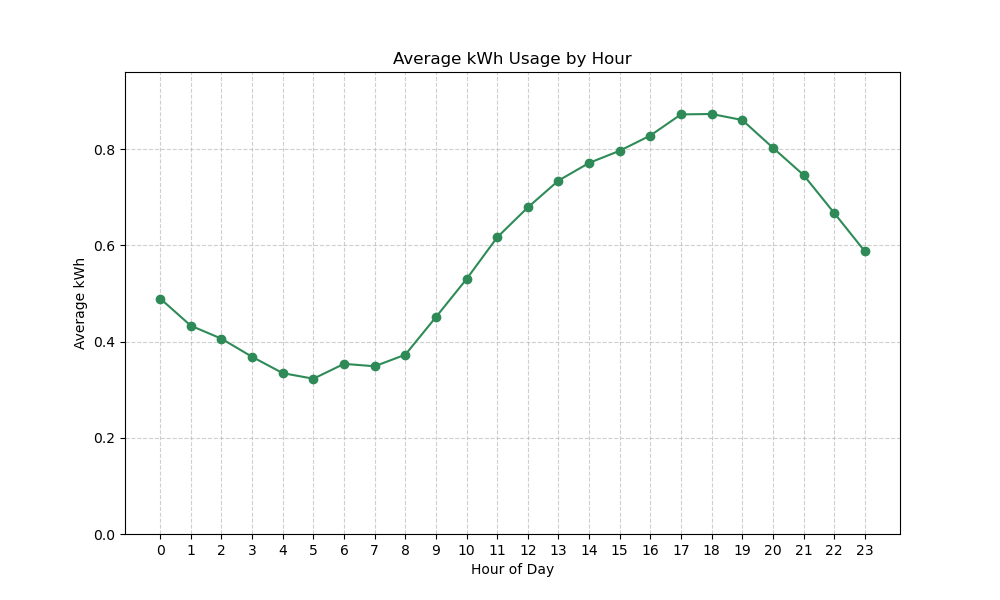
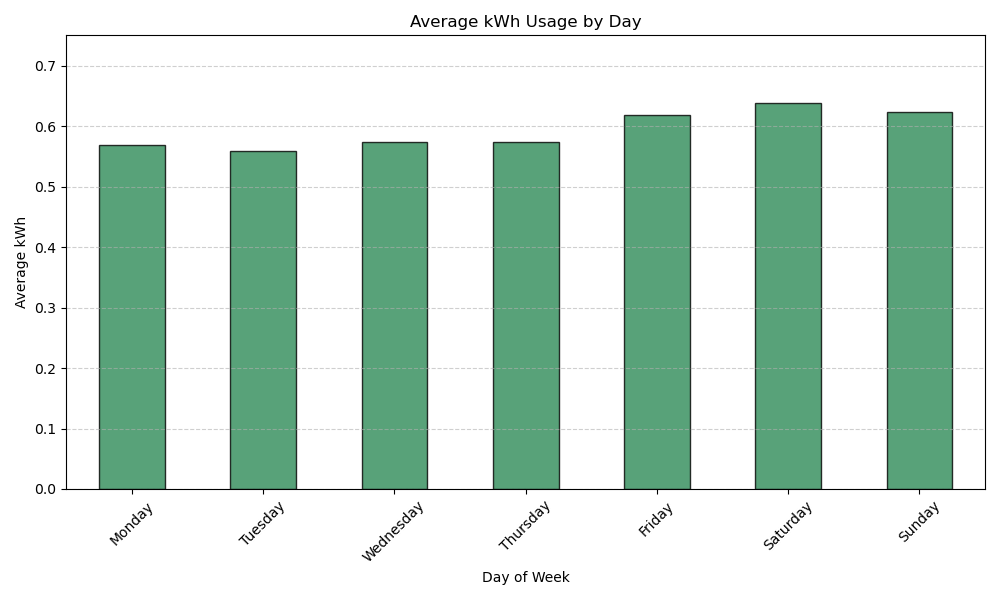
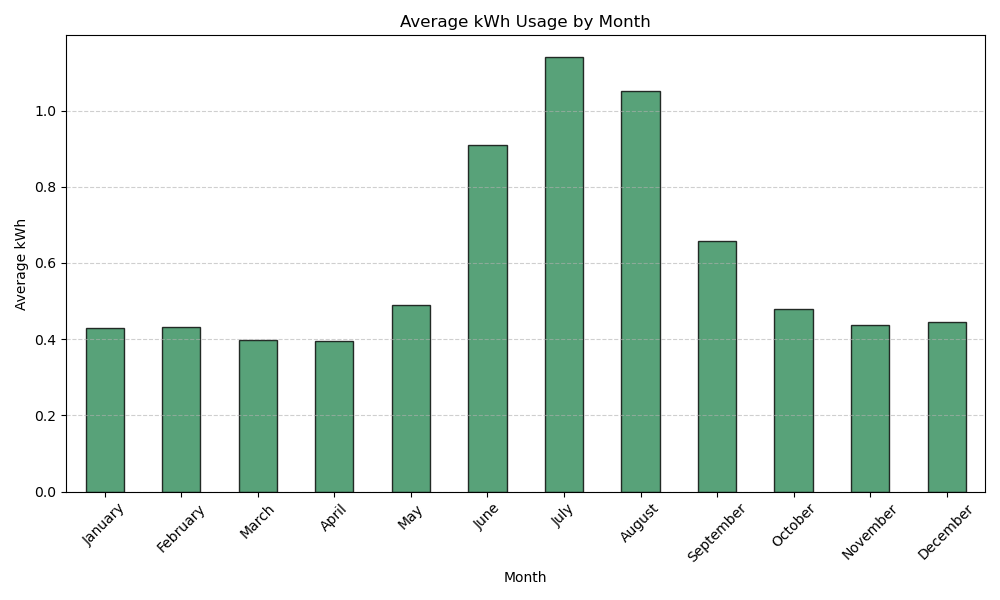
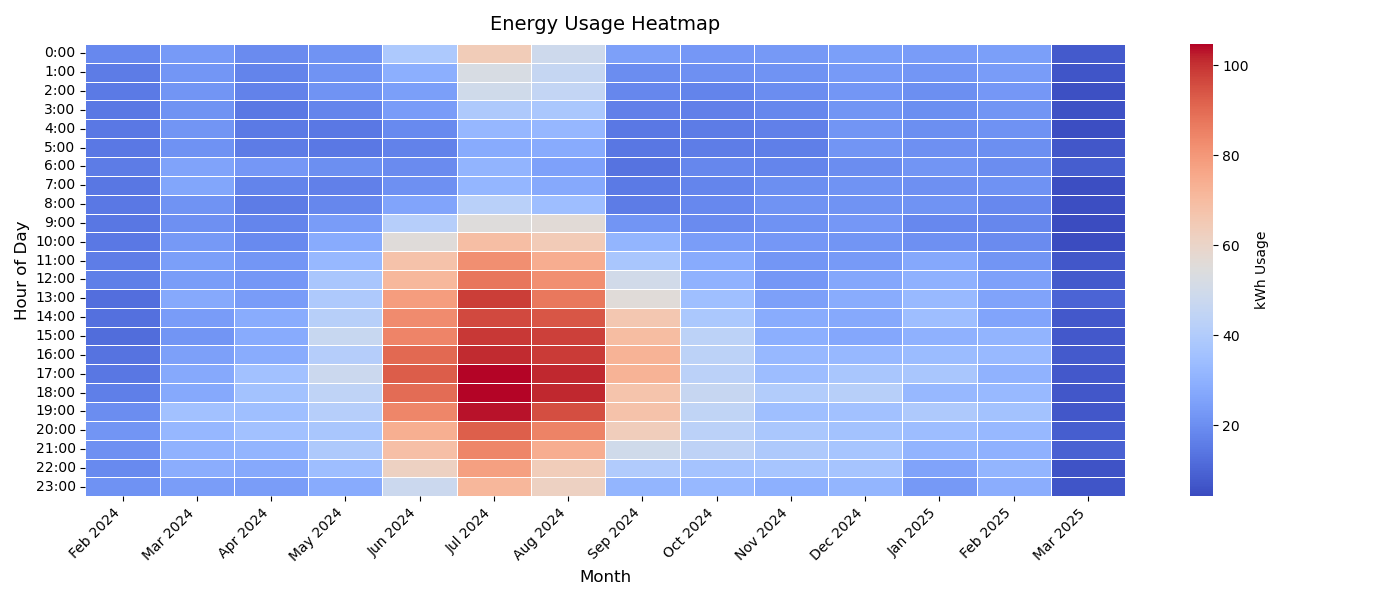
To analyze my electricity usage, I retrieved a year's worth of 30-minute interval data from my provider. I cleaned and reformatted it for time series visualization, ran basic statistical checks for missing and outlier values, and explored patterns through distributions, averages by hour, day, and month, and a heatmap.
I initially plotted daily electricity usage over the year with a 7-day trailing average, but it felt too compressed. To provide a clearer, more focused view, I switched to a bar plot using a 30-day rolling window.
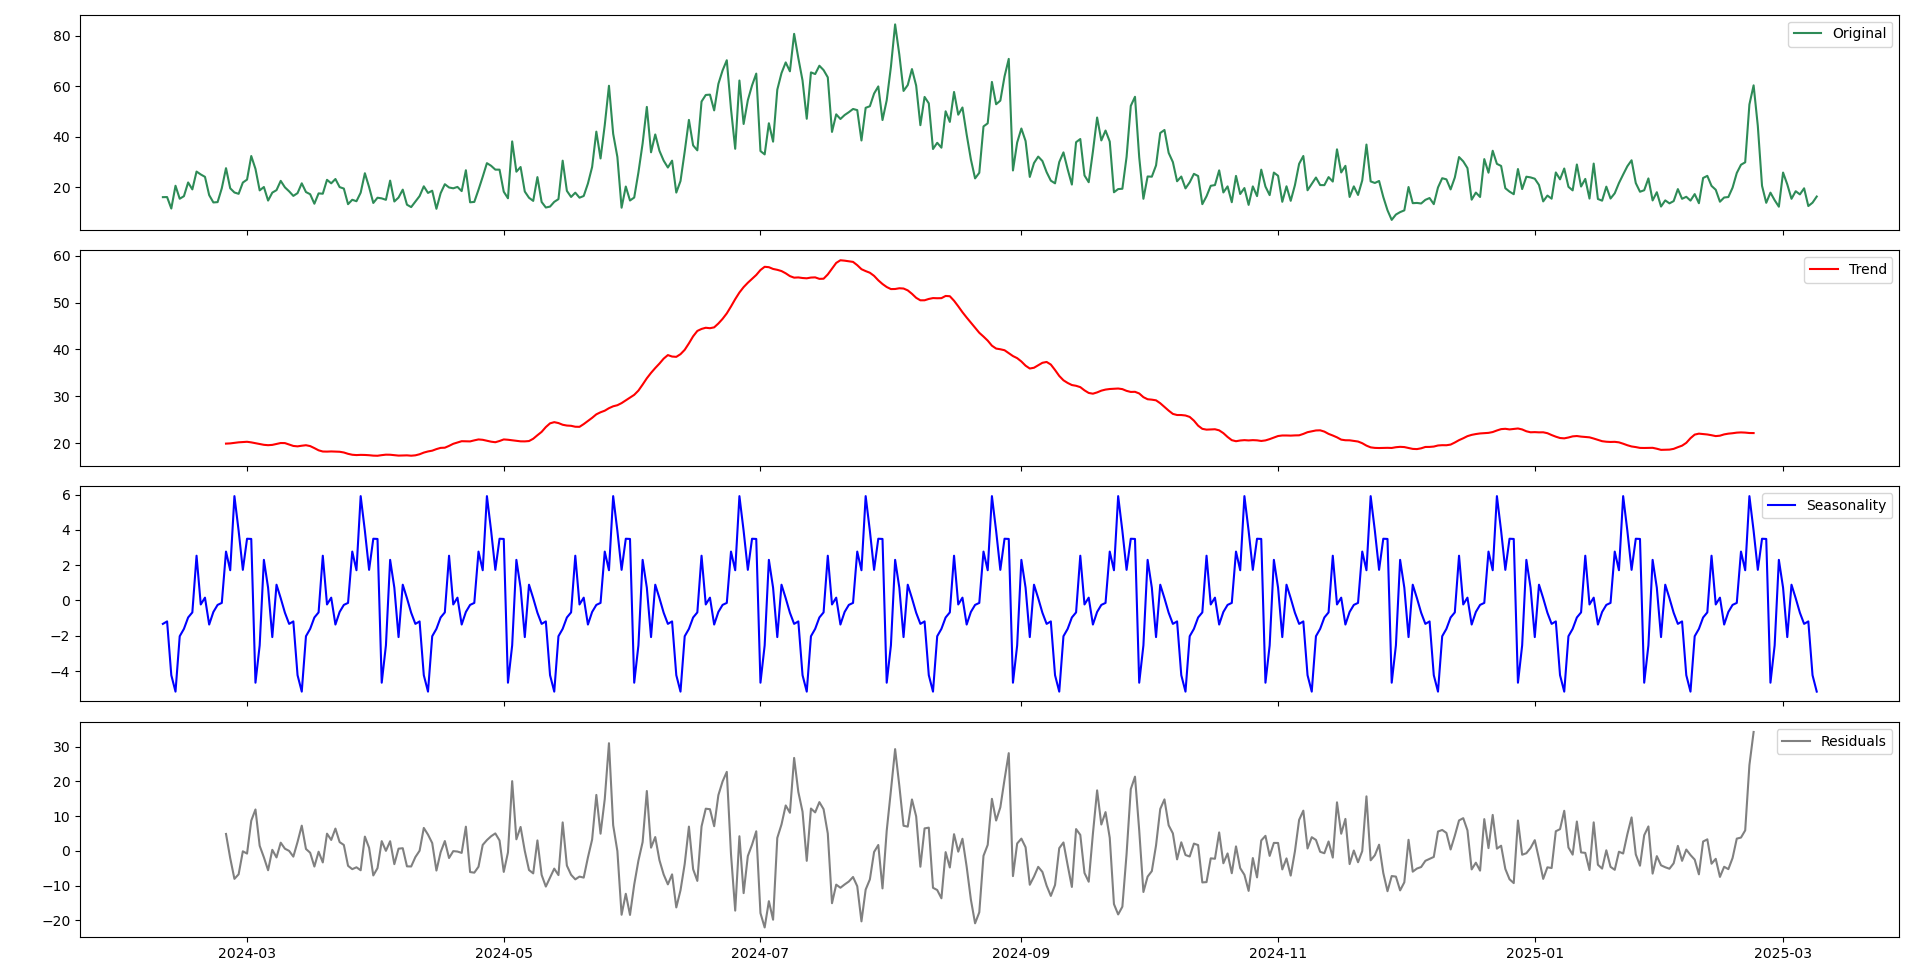
The earlier visualizations suggested the presence of seasonal patterns, so I conducted formal tests to check for stationarity. In addition, I performed time series decomposition and analyzed autocorrelation and partial autocorrelation plots to better understand the data's underlying structure. Here is the time series decomposition.
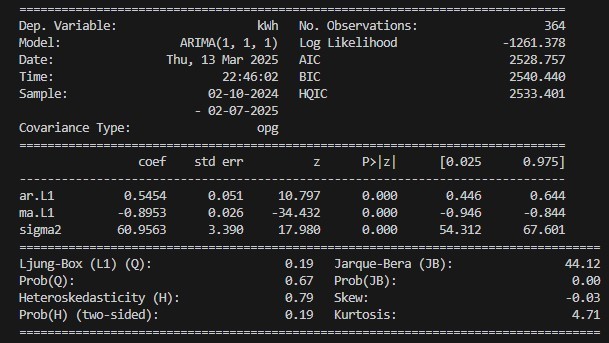
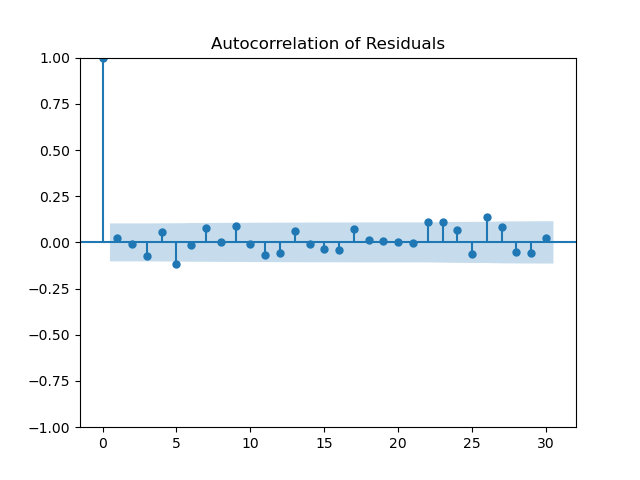
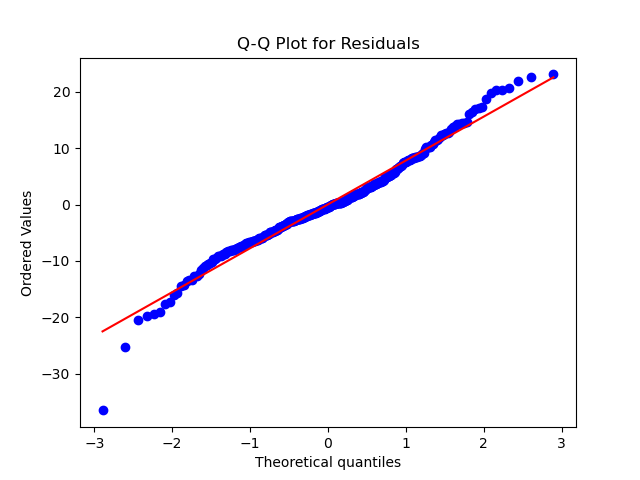
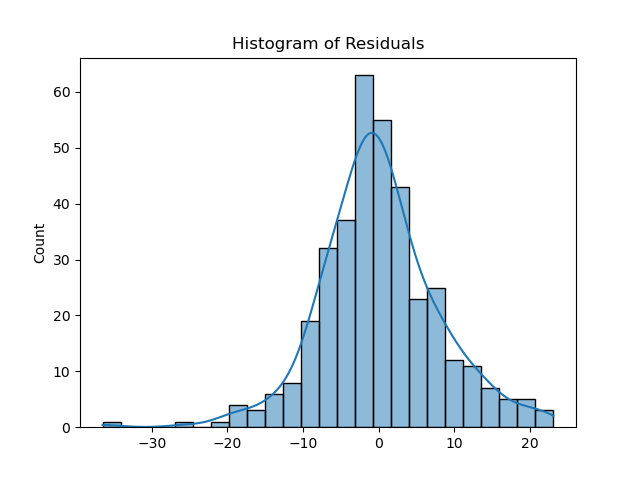
To compare forecasting performance, I trained an ARIMA model on both 30-minute interval and daily data. By analyzing summary statistics, Ljung-Box test results, and residual diagnostics (autocorrelation plots, QQ plots, and histograms), I determined that the daily model provided a better fit. Here are some of the outputs.
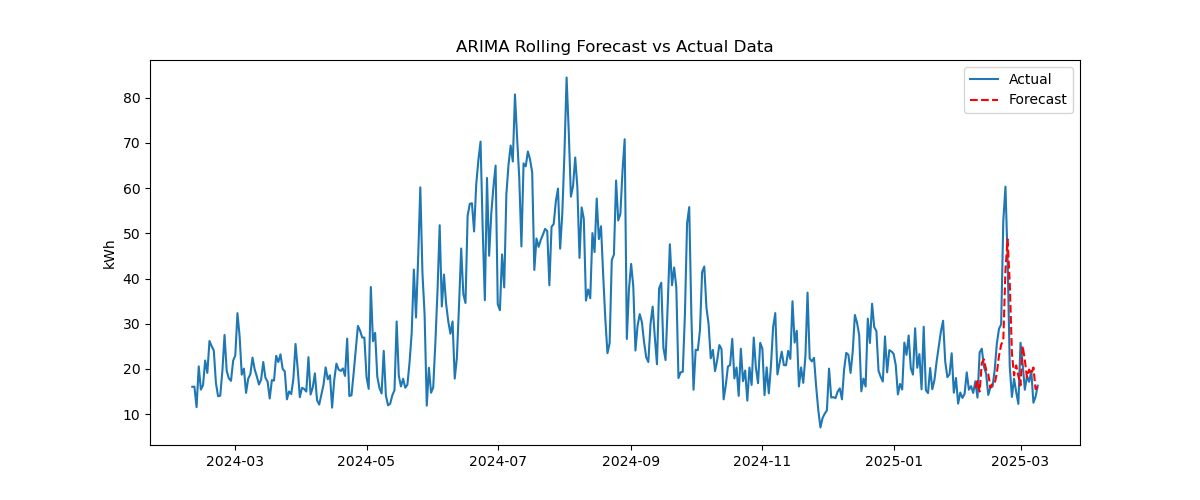
To evaluate the model, I forecasted kWh usage for the final month of data and compared it to actual values, calculating MSE along the way. A sudden cold week in February caused a spike in electricity usage, leading to an underprediction. To improve accuracy, I switched to a rolling forecast, which greatly enhanced performance. The improved results are shown below.
Results
Model 1:
Mean Absolute Error (MAE): 7.0699
Root Mean Squared Error (RMSE): 12.3489
Mean Absolute Percentage Error (MAPE): 24.2606
Total Forecasted Usage for the month: 511.45 kWh
Total Actual Usage for the month: 666.08 kWh
Model 2:
Mean Absolute Error (MAE): 5.6073
Root Mean Squared Error (RMSE): 8.1920
Mean Absolute Percentage Error (MAPE): 24.9710
Total Forecasted Usage for the month: 656.77 kWh
Total Actual Usage for the month: 666.08 kWh
Conclusion
While the analysis of the first model suggested it was a decent fit, it struggled to capture sudden spikes, leading to consistent underprojections. As a result, the model was off by approximately 150 kWh for the month, or about 23%—a significant error. The second model showed a slight reduction in MAE and followed the trend more accurately, alternating between over and under projections. This resulted in a much closer total forecast, with an error of only around 10 kWh, or 1%.
Although the second model is an improvement, it isn't practical for use in a budgeting tool. I considered using a SARIMA model to account for seasonality, but with only one cycle of data, it's not feasible, as SARIMA typically requires two or three.
Overall, I'm satisfied with the results given the unexpected data spike, but I recognize there is still room for improvement. I plan to retest the first model throughout the spring to assess its performance in the coming months.
In Progress & Next Steps
- Develop an LSTM ML model with additional input data, including number of occupants & weather
- Gather local pricing information, including surge pricing, to convert kWh to dollar amounts
- Apply the model to gas and water bills for a complete utility forecast